DevOps
So I'm a Platform Engineer who is currently working mostly on Dockerfiles, Ansible Playbooks and Kubernetes YAMLs (FUCK HELM AND YAML TEMPLATING). Wanted to know if it's worth it to invest in learning Pulumi, and advocating for its use in our company? As far as I've found out we can unify all of our IaC codes by using Pulumi and get rid of multiple tooling/languages that we currently use + writing tests for our IaC code hopefully. which we do not as of now. What is Lemmy's opinion about Pulumi? Is it a shiny new thing that I'm getting hopelessly hyped about because of our current problems, or is it a legit thing that delivers substantial improvements to our flow?
HT:@DanHon This awesome read of Ripley of *Aliens* fame meets Dev/Ops
cross-posted from: https://lemmy.ml/post/5653264 > I'm using Grafana for one of my hobby projects which is also deployed to a public-facing server. > > I am the only user of Grafana as it is supposed to be read-only for anonymous access. > > My current workflow is: > 1. Run Grafana locally. > 2. Make changes to local dashboards, data-sources, ... > 3. Stop local Grafana. > 4. Stop remote Grafana. > 5. Copy local `grafana.db` to the remote machine. > 6. Start remote Grafana. > 7. Goto (1) > > However this feels terribly inefficient and stupid to my mind 😅 > > --- > > To automate parts of this process, I tried [gdg](https://github.com/esnet/gdg) and [grafana-backup-tool](https://github.com/ysde/grafana-backup-tool). > > I couldn't get the former to work w/ my workflow (local storage) as it barfed at the very start w/ the infamous "invalid cross-device link" Go error. > > The latter seems to work but only partially; for example organisations are not exported. > > --- > > ❓ Given I may switch to PostgreSQL as Grafana's DB in the near future, my question is, what is the best way to automate my process short of stopping Grafana and copying database files.
 kamal-deploy.org
A few days DHH (from 37signals) wrote about how they [moved off the cloud](https://world.hey.com/dhh/our-cloud-exit-has-already-yielded-1m-year-in-savings-db358dea) and how that has helped reduce their costs by a good measure. Well, earlier today, he announced the first bit of tooling that they used as part of their cloud exit move: [Kamal](https://kamal-deploy.org/) - which is already at version 1.0 and, according to DHH, stable. --- I took a quick look at the documentation and it looks to me like an augmented and feature-rich Docker Compose which is, to no surprise, rather opinionated. I think anyone who's had experience with the simplicity of Docker Swarm compared to K8s would appreciate Kamal's way. Hopefully it will turn out to be more reliable than Swarm though. I found it quite a pragmatic approach to containerising an application suite with the aim of covering a good portion of a the use-cases and requriements of smaller teams. --- *PS: I may actually try it out in an ongoing personal project instead of Compose or K8s. If I do, I'll make sure to keep this post, well, posted.*
### Update Turned out I didn't need to convert any series to gauges at all! The problem was that I had botched my Prometheus configuration and it wasn't ingesting the probe results properly 🤦♂️ Once I fixed that, I got all the details I needed. For posterity you can view [lemmy-meter's configuration on github](https://github.com/bahmanm/lemmy-meter/tree/44bb80671dfc62f0d7899c4b5a51aab75eb7d0e9/config). ---- cross-posted from: https://lemmy.ml/post/5114491 > I'm using *[blackbox_exporter](https://github.com/prometheus/blackbox_exporter)* to monitor a dozen of websites' performance. And that is working just fine for measuring RTT and error rates. > > I'm thinking about creating a single gauge for each website indicating whether it is up or down. > > --- > > I haven't been able to find any convincing resource as to if it is mathematically correct to convert such series to guages/counters - let alone how to do that. > > So my questions are > * Have I missed a relevant option in blackbox_exporter configurations? > * Do you recommend converting series to gauges/counters? If yes, can you point me to a resources so that I can educate myself on how to do it? --- PS: To my surprise, there were no communities around Observability in general and Prometheus in particular. So I went ahead and created one: [!observability@lemmy.ml](https://lemmy.ml/c/observability)
Hey all, I'm not sure if this is the best place to post, but I cannot find a dedicated OpenStack sub lemmy. I'm trying to get experience with OpenStack, and it seems most tutorials are using something called "OpenMetal". This is subscription based with a free trial (which I may end up having to use), but without OpenMetal, it seems I only have access to one OS to install when creating an instance. See [here](https://i.imgur.com/00XLc3Q.png). Is there a way for me to install something like Ubuntu 22.04 without the help from OpenMetal? If so, how would I go about doing it?
_Originally [discussed on Matrix](https://matrix.to/#/!czpAhMQgXXiRMvhOef:libera.chat/$mXNVayx6HpJTjpZvQyCdfUT_jaM0xYVTuAs_5I9xsrc?via=ansible.com&via=libera.chat&via=matrix.org)._ --- **TLDR;** Ansible handlers are added to the global namespace. --- Suppose you've got a role which defines a handler `MyHandler`: ``` - name: MyHandler ... listen: "some-topic" ``` Each time you `import`/`include` your role, a **new** reference to `MyHandler` is added to the global namespace. As a result, when you `notify` your handler via the topics it `listen`s to (ie `notify: "some-topic"`), **all** the references to `MyHandler` will be executed by Ansible. If that's not what you want, you should `notify` the handler by name (ie `notify: MyHandler`) in which case Ansible will stop searching for other references as soon as it finds the first occurrence of `MyHandler`. That means `MyHandler` will be executed only once.

cross-posted from: https://lemmy.ml/post/4079840 > *"Don't repeat yourself. Make Make make things happen for you!"* 😎 > > I just created a public room dedicated to all things about Make and Makefiles. > > `#.mk:matrix.org` > or > matrix.to/#/#.mk:matrix.org > > Hope to see you there.
Hey all, I would like to get the above certifications. What resources did you use to study? I can't afford the official training and my employer doesn't want to pay for it. Any and all help, and all tales of your experience is aplriciated.
cross-posted from: https://lemmy.world/post/2481800 > tf-profile v0.4.0 Released! > > tf-profile is a CLI tool to profile Terraform runs, written in Go. > > Main features: > - Modern CLI (cobra-based) with autocomplete > - Read logs straight from your Terraform process (using pipe) or a log file > - Can generate global stats, resource-level stats or visualizations > - Provides many levels of granularity and aggregation and customizable outputs > > Check it out, feedback much appreciated ❤️ [https://github.com/datarootsio/tf-profile](https://github.com/datarootsio/tf-profile) > > Built with ❤️ by [Quinten](https://www.linkedin.com/in/quinten-bruynseraede-57289515b?originalSubdomain=be)
Hi. We successfully store secrets in ansible variables files with either ansible-vault or [sops](https://github.com/getsops/sops). It is a good approach when Ansible itself configures something that requires a secret, such as configuring a database admin password. But I'd like to ask you about how you store secrets meant to be used by applications. Example: we have a an application in PHP with a config.php file with all credentials needed by the application. Developers have a config.php setup to work with the test environment, while we maintain a different `config.php` for production in production machines. Nowadays this `config.php` file is stored in ansible repository, encrypted by ansible-vault or sops. We thought about moving the `config.php` production file to the application repository, so we could get advantage of the CI/CD pipeline. It doesn't smell right, because it would require to encrypt it somehow, and store keys to decrypt it in CI/CD, but I decided to ask you anyway what do you think of that and how you solved it yourselves. Thanks!
I'm trying to move my org into a more gitops workflow. I was thinking a good way to do promotions between environments would be to auto sync based on PR label. Thinking about it though, because you can apply the same label multiple times to different PRs, I can see situations where there would be conflicts. Like a PR is labeled "qa" so that its promoted to the qa env, automated testing is started, a different change is ready, the PR is labeled "qa", and it would sync overwriting the currently deployed version in qa. I obviously don't want this. Is there a way to enforce only single instances of a label on a PR across a repository? Or maybe there is some kind a queue system out there that I'm not aware of? I'm using github, argocd, and circleci.
This looks like an interesting project. I've been trying to track these teams and orgs and there's really no easy way. Maybe this can be a solution.
cross-posted from [!softwareengineering@group.lt](https://group.lt/c/softwareengineering): https://group.lt/post/46385 > Adopting DevOps practices is nowadays a recurring task in the industry. DevOps is a set of practices intended to reduce the friction between the software development (Dev) and the IT operations (Ops), resulting in higher quality software and a shorter development lifecycle. Even though many resources are talking about DevOps practices, they are often inconsistent with each other on the best DevOps practices. Furthermore, they lack the needed detail and structure for beginners to the DevOps field to quickly understand them. > > In order to tackle this issue, this paper proposes **four foundational DevOps patterns: Version Control Everything, Continuous Integration, Deployment Automation, and Monitoring**. The patterns are both detailed enough and structured to be easily reused by practitioners and flexible enough to accommodate different needs and quirks that might arise from their actual usage context. Furthermore, the **patterns are tuned to the DevOps principle of Continuous Improvement by containing metrics so that practitioners can improve their pattern implementations**. --- The article does not describes but actually identified and included 2 other patterns in addition to the four above (so actually 6): - **Cloud Infrastructure**, which includes cloud computing, scaling, infrastructure as a code, ... - **Pipeline**, "important for implementing Deployment Automation and Continuous Integration, and segregating it from the others allows us to make the solutions of these patterns easier to use, namely in contexts where a pipeline does not need to be present." 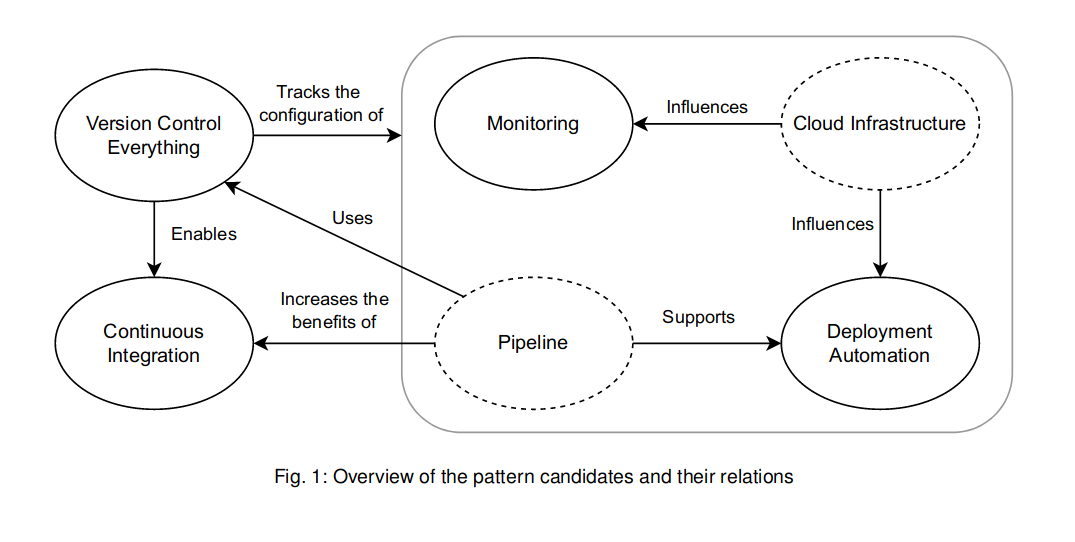 The paper is interesting for the following structure in describing the patterns: > - Name: An evocative name for the pattern. > - Context: Contains the context for the pattern providing a background for the problem. > - Problem: A question representing the problem that the pattern intends to solve. > - Forces: A list of forces that the solution must balance out. > - Solution: A detailed description of the solution for our pattern’s problem. > - Consequences: The implications, advantages and trade-offs caused by using the pattern. > - Related Patterns: Patterns which are connected somehow to the one being described. > - Metrics: A set of metrics to measure the effectiveness of the pattern’s solution implementation.
Hi guys, I have the following variable in Ansible: ```yaml additional_lvm_disks: persistent: device: xvdb part: 1 crypt: yes logical_volumes: persistent_data: size: 100%VG mount: /data volatile_hdd: device: xvdc part: 1 crypt: yes logical_volumes: var_cache: size: 50%VG mount: /var/cache var_log: size: 50%VG mount: /var/log volatile_ssd: device: xvde part: 1 crypt: yes logical_volumes: tmp: size: 30%VG mount: /tmp volatile_data: size: 70%VG mount: /media/volatile_data ``` Now I want to iterate over this structure and create encrypted disks with an LVM on top. I named the PVs according to the keys, so I came up with this (which, obviously, does not work properly): ```yaml - name: Install parted apt: name: [ 'parted' ] state: present - name: Install lvm2 dependency package: name: lvm2 state: present - name: list the devices and mounts being specified debug: msg: "{{ item.device }} - {{ item.mount }}" with_items: "{{ var_devices_mounts }}" - name: Check if devices exist fail: msg: "device {{ item.value.device }} does not exist or is corrupted }} " when: ansible_facts['devices'][item.value.device]['size'] | length == 0 loop: "{{ lookup('dict', additional_lvm_disks) }}" - name: Check Secret File Creation command: sh -c "dd if=/dev/urandom of={{ var_keyfile_path }} bs=1024 count=4" args: chdir: "{{ var_keyfile_dir }}" creates: "{{ var_keyfile_path }}" - name: Check Secret File Permissions file: state: file path: "{{ var_keyfile_path }}" owner: root group: root mode: "0400" - name: Create Partition parted: device: "/dev/{{ item.value.device }}" number: 1 flags: [ lvm ] state: present loop: "{{ lookup('dict', additional_lvm_disks) }}" - name: Create LUKS container with a passphrase luks_device: device: "/dev/{{ item.value.device }}1" state: "present" passphrase: "123456789" loop: "{{ lookup('dict', additional_lvm_disks) }}" - name: Add keyfile to the LUKS container luks_device: device: "/dev/{{ item.value.device }}1" new_keyfile: "{{ var_keyfile_path }}" passphrase: "123456789" loop: "{{ lookup('dict', additional_lvm_disks) }}" - name: (Create and) open LUKS container luks_device: device: "/dev/{{ item.value.device }}1" state: "opened" name: "{{ item.value.device }}1_crypt" keyfile: "{{ var_keyfile_path }}" loop: "{{ lookup('dict', additional_lvm_disks) }}" - name: Set the options explicitly a device which must already exist crypttab: name: "{{ item.value.device }}1_crypt" backing_device: "/dev/{{ item.value.device }}1" state: present password: "{{ var_keyfile_path }}" opts: luks loop: "{{ lookup('dict', additional_lvm_disks) }}" - name: Creating Volume Group lvg: vg: "{{ item.key }}" pvs: "/dev/mapper/{{ item.value.device }}1_crypt" loop: "{{ lookup('dict', additional_lvm_disks) }}" - name: Creating Logical Volume lvol: vg: "{{ item.value.volume_group }}" lv: "{{ item.key }}" size: 100%VG loop: "{{ lookup('dict', (additional_lvm_disks | dict2items | combine(recursive=True, list_merge='append')).value.logical_volumes) }}" - name: create directorie(s) file: path: "{{ item.value.mount }}" state: directory loop: "{{ lookup('dict', (additional_lvm_disks | dict2items | combine(recursive=True, list_merge='append')).value.logical_volumes) }}" - name: format the ext4 filesystem filesystem: fstype: ext4 dev: "/dev/{{ item.value.volume_group }}/{{ item.key }}" loop: "{{ lookup('dict', (additional_lvm_disks | dict2items | combine(recursive=True, list_merge='append')).value.logical_volumes) }}" - name: mount the lv mount: path: "{{ item.value.mount }}" src: "/dev/{{ item.value.volume_group }}/{{ item.key }}" fstype: ext4 state: mounted loop: "{{ lookup('dict', (additional_lvm_disks | dict2items | combine(recursive=True, list_merge='append')).value.logical_volumes) }}" ``` I found that I probably need [the product filter for a loop](https://docs.ansible.com/ansible/2.8/user_guide/playbooks_filters.html#product-filters) to create a cartesian product of all the volume groups and their disks as well as all the logical volumes and their volume groups, the latter looking something like this: ```yaml - { volume_group: volatile_hdd, logical_volume: var_cache, size: 50%VG } - { volume_group: volatile_hdd, logical_volume: var_log, size: 50%VG } ``` Sadly I can't wrap my head around this and there are no good tutorials or examples I could find. How do I iterate over the "monster dictionary" above to get what I want?

 t.me
t.me
Hey guys, I’ve been curating for more than a year DevOps/SRE news, tools et. al. along with a Golang one that I shared in !golang If you find the content interesting, feel free to subscribe, I don’t publish any ads and stuff, it’s just pure content.
 www.theregister.com
> Two things everyone knows about Kubernetes are: first, that it has won in the critically important container orchestration space, and second, that its complexity is both a barrier to adoption and a common cause of errors.
 www.viva64.com
Let's say you use GitHub, write code, and do other fun stuff. You also use a static analyzer to enhance your work quality and optimize the timing. Once you come up with an idea - why not view the errors that the analyzer gave right in GitHub? Yeah, and also it would be great if it looked nice. So, what should you do? The answer is very simple. SARIF is right for you. This article will cover what SARIF is and how to set it up. Enjoy the reading!

 www.viva64.com
There was a task to automate static analysis packages included in the distribution. The best tool for this is PVS-Studio, as it can catch compiler calls using strace, thus not requiring any changes in the build scripts. First, controled by pvs-studio-analyzer the build was started, and the log was collected. Then the log was analyzed resulting in the report. Let's look at how to set this up without making edits to each package.
www.viva64.com
We have classified our blog posts in several topics. Speaking of which, I suggest reading these articles on code check automation with PVS-Studio. In other words, the posts on DevOps and DevSecOps.
 www.guru99.com
A Code Review tool automates the code audit process. They help in static code analysis which is essential to deliever a reliable software application. There are plethora of Code Review Tools in the market and selecting one for your project could be a challenge. Following is a curated list of top code analysis tools and code review tools for java with popular features and latest download links. The list contains best code review tools including open-source as well as commercial.
 www.viva64.com
Sometimes, tired of endless code review and debugging, you start wondering if there are ways to make your life easier. After some googling or merely by accident, you stumble upon the phrase, "static analysis". Let's find out what it is and how it can be used in your project.
 www.viva64.com
Static code analysis is most effective when changing a project, as errors are always more difficult to fix in the future than at an early stage. We continue expanding the options for using PVS-Studio in continuous development systems. This time, we'll show you how to configure pull request analysis using self-hosted agents in Microsoft Azure DevOps, using the example of the Minetest game.
 www.viva64.com
One of the most relevant scenarios for using the PVS-Studio analyzer is its integration into CI systems. Even though a project analysis by PVS-Studio can already be embedded with just a few commands into almost any continuous integration system, we continue to make this process even more convenient. PVS-Studio now supports converting the analyzer output to the TeamCity format-TeamCity Inspections Type. Let's see how it works.
 www.viva64.com
2019 was a very busy year in terms of conferences. Our team could leave for whole weeks on business trips. As you know, the conference is perfect time to share knowledge. In addition to giving talks and telling many interesting things at our booth, we also learned a lot from communicating with conference participants and speakers. So at the Joker 2019 conference in fall, a talk from Dalia Abo Sheasha "Migrating beyond Java 8" inspired us to implement a new diagnostic rule that allows us to detect incompatibilities in the Java SE API between different versions of Java. This is what we will talk about.
 habr.com
It is easy to try a static code analyzer. But it requires skills to introduce it in the development of an old large project. If the approach is incorrect, the analyzer can add work, slow down development, and demotivate the team. Let's briefly discuss how to properly integrate static analysis into the development process and start using it as part of CI/CD.
I am using hetzner.com for my servers, and Lemmy is hosted time4vps.com. But I am curious about other providers that you can recommend, especially ones that arent under strict laws [like this](https://dev.lemmy.ml/post/32855).
 www.viva64.com
The purpose of this article is to give a general overview of the features of the PVS-Studio static analyzer. The simplest and most informative way to do this is to show the tool in action. We'll be sharing examples demonstrating the analysis process using the Visual Studio plugin, the algorithm of running the analyzer under Linux, and analysis log import into SonarQube.
 www.slideshare.net
www.slideshare.net
On Japanese DX
 community.platformio.org
We’re happy to announce the next release of PlatformIO Core 4.2.0
 www.viva64.com
DevOps is a methodology aiming at establishing closer collaboration between programmers and system administrators in the software development process. A DevOps engineer is a specialist working on the intersection of these two fields. A DevOps engineer's primary objective is to take the predictability, efficiency, and security of software development to the highest level possible. DevSecOps is a further development of the DevOps concept that, besides automation, addresses the issues of code quality and reliability assurance.
There are many ways that can assist in improvement the program’s quality. In this article, we invite you to consider one of them – static code analysis.